
Kanaries
AI-powered exploratory data analysis workspace — upload data, drag-and-drop charts, and chat with AI to uncover insights
| What is it | AI-powered exploratory data analysis workspace — upload data, drag-and-drop charts, and chat with AI to uncover insights |
|---|---|
| Pricing | Freemium — from $10.75/mo |
| Free tier | Yes |
| Platform | Web Application |
| Best for | exploring and visualizing large datasets, generating interactive charts without writing code |
| Domain registered | 2021 |
Data updated Sept. 19, 2026
What does Kanaries do?
Kanaries is a data analysis and visualization platform that turns spreadsheets and DataFrames into interactive, visual dashboards. It's not just a charting tool — it bundles several open-source and commercial products all aimed at making exploratory data analysis (EDA) faster and more intuitive. The main hook is that you can either plug it into your existing workflow (Jupyter Notebook, RStudio) or use it as a standalone desktop app, and then instantly create drag-and-drop visualizations or ask questions about your data in plain English.
Under the hood, Kanaries offers a collection of tools: PyGWalker lets you convert a pandas DataFrame into an interactive visual analytics app with one line of code, while GWalkR does the same for R users. The Graphic Walker Desktop gives you a native offline experience, and the Graphic Walker Component lets you embed the same visual analytics into web apps built with React or Vue. The standout feature is VizChat — you can type a question like "show me sales by region" and the AI generates the chart and answer for you. The AI also suggests next steps in your analysis.
Who should use Kanaries? Data analysts, data scientists, and business users who want to explore tabular data without writing tons of code. It's especially handy for Jupyter Notebook users who want a quick visual overview of their data, or for teams that need to share interactive dashboards without spinning up a full BI tool. The learning curve is low: import your data, drag fields onto axes, and let the AI help you find patterns.
Key features
What makes it stand outWho is Kanaries for?
Who benefits most from this toolPricing
Free tier available — start without a credit cardEducation
Everything in Pro, plus:
- Connect to PyGWalker
- Collaboration with others in your organization
Pro
- Addon: RATH, autopilot for EDA
- Dashboard and data app sharing
- GPT-powered data exploration
- Team collaboration
- More data sources (DuckDB, PG, Snowflake, etc.)
- Build visualizations with drag-and-drop / chat interface
Enterprise
- Developer Platform
- Engineering Support
- SSO Integration
- OLAP Engine Integration
- Large Scale of Data Support
- Self-deployment
Trust & presence
Gallery
Click any image to enlargeAlternatives in For Data Analytics
 Quadratic
Verified
For Data Analytics
Quadratic
Verified
For Data Analytics
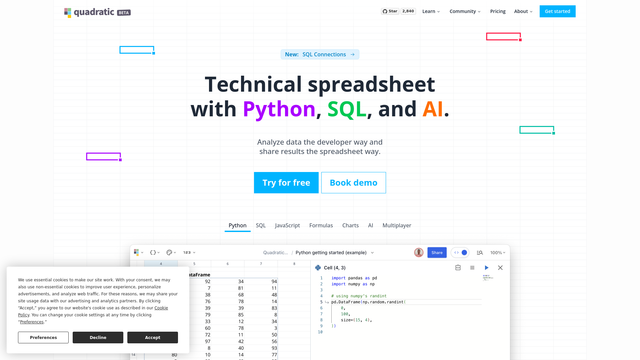
Quadratic is an AI-powered spreadsheet for quick insights and advanced data analysis. Import data or connect your database, then leverage built-in AI and Python to generate summaries, charts, and more. Collaborate in real time right from the browser.
 ChartPixel
Verified
For Data Analytics
ChartPixel
Verified
For Data Analytics
AI data analysis tool — upload a spreadsheet, get automatic charts, insights, and forecasts in seconds.
 Thebricks
Verified
For Data Analytics
Thebricks
Verified
For Data Analytics
AI data analyst that turns spreadsheets into interactive dashboards and reports in minutes.
 Pandas AI
Verified
For Data Analytics
Pandas AI
Verified
For Data Analytics
AI business intelligence agent — ask questions about your data in plain English and get instant charts, dashboards, and insights.
 Quaeris
Verified
For Data Analytics
Quaeris
Verified
For Data Analytics
Enterprise analytics platform that uses AI agents to answer business questions in plain English with full data governance.
 Columns AI
Verified
For Data Analytics
Columns AI
Verified
For Data Analytics
AI-powered data platform that cleans messy files, builds analysis flows, and creates visual reports automatically.
 vizGPT
Verified
For Data Analytics
vizGPT
Verified
For Data Analytics
Create data visualizations and dashboards by simply asking questions or using a drag-and-drop interface.
 EzInsights AI
Verified
For Data Analytics
EzInsights AI
Verified
For Data Analytics
AI-powered business intelligence platform — ask data questions in plain English, get instant reports and dashboards.