
Gigapipe
Open-source observability platform that consolidates logs, metrics, and traces into a single, cost-effective stack.
| What is it | Open-source observability platform that consolidates logs, metrics, and traces into a single, cost-effective stack. |
|---|---|
| Pricing | Freemium — from €349/mo |
| Free tier | Yes |
| Platform | Web Application |
| API | Yes |
| Best for | consolidating monitoring tools from Grafana Cloud or Datadog, correlating application logs with performance metrics |
| Domain registered | 2009 |
Data updated Sept. 19, 2026
What does Gigapipe do?
Gigapipe is an observability platform designed to replace complex, vendor-locked services. It brings together logs, metrics, traces, and profiling data into a single, unified system. You keep using the Grafana interface you're familiar with for dashboards and visualization, but Gigapipe replaces the backend storage and processing layers. This means you can ingest data from tools like Prometheus, Loki, and OpenTelemetry, but store and query it all through one high-performance engine.
The platform is built on ClickHouse, a columnar database known for speed, which allows for fast queries and deep correlation across different data types. A key advantage is its polyglot design; it supports multiple ingestion and query protocols out of the box, so you can integrate it with your existing tooling without rewriting everything. It's also open-source (AGPLv3), giving you the freedom to self-host, customize, and avoid being locked into a specific vendor's ecosystem and pricing model.
Gigapipe is built for engineering teams that manage large-scale, distributed systems. It's a practical choice for DevOps and SRE teams who are tired of juggling separate tools for logs and metrics or facing unpredictable cloud observability bills. It works well for organizations that want to consolidate their monitoring stack, gain better data correlation, and maintain full control over their observability data and costs.
Key features
What makes it stand outWho is Gigapipe for?
Who benefits most from this toolPricing
Free tier available — start without a credit cardOpen-source
- Configurable RAM
- Configurable vCPU
- Configurable Storage
- Unlimited usage
- AGPLv3
- Community support
Pro
- 100€ per additional 1 TB additional storage
- 12 max additional storage
- Up to 5 TB/month Ingestion
- 600 GB NVMe Storage (base)
- Up to 16 CPUs & 32 GB RAM
- 14-day free trial
- Standalone deployment
- Email Support
Enterprise
- Custom resources matching desired monthly telemetry ingestion
- High Availability & multi-node cluster deployment
- Custom data retention
- Dedicated SLA
- Premium support
- Onboarding & migration assistance
Trust & presence
Gallery
Click any image to enlargeAlternatives in Non-AI Developer Tools
 Dokifly
Verified
Non-AI Developer Tools
Dokifly
Verified
Non-AI Developer Tools
No-code HTML to PDF API — design templates in a dashboard or describe documents in plain English, then generate from n8n, Make, or Bubble.
 Zread
Verified
Non-AI Developer Tools
Zread
Verified
Non-AI Developer Tools
Read and explore GitHub repositories — add private repos, browse trending code, and connect via CLI or MCP.
Similar tools
 Logz.io
Verified
Monitor
Logz.io
Verified
Monitor
AI-powered observability platform that collects, analyzes, and visualizes logs, metrics, and traces in one place
 Telemetry Harbor
For Data Analytics
Telemetry Harbor
For Data Analytics
All-in-one platform to collect, store, and visualize IoT and infrastructure metrics with built-in managed Grafana dashboards.
 DoubleCloud with GPT-4
Verified
Data & Analytics
DoubleCloud with GPT-4
Verified
Data & Analytics
Managed data analytics platform with open-source tools like ClickHouse, Kafka, and Airflow for building fast data pipelines.
 Dash0
Verified
Monitor
Dash0
Verified
Monitor
OpenTelemetry-native observability platform — collect traces, metrics, and logs from your applications in one place.
 Defapi
Verified
AI API
Defapi
Verified
AI API
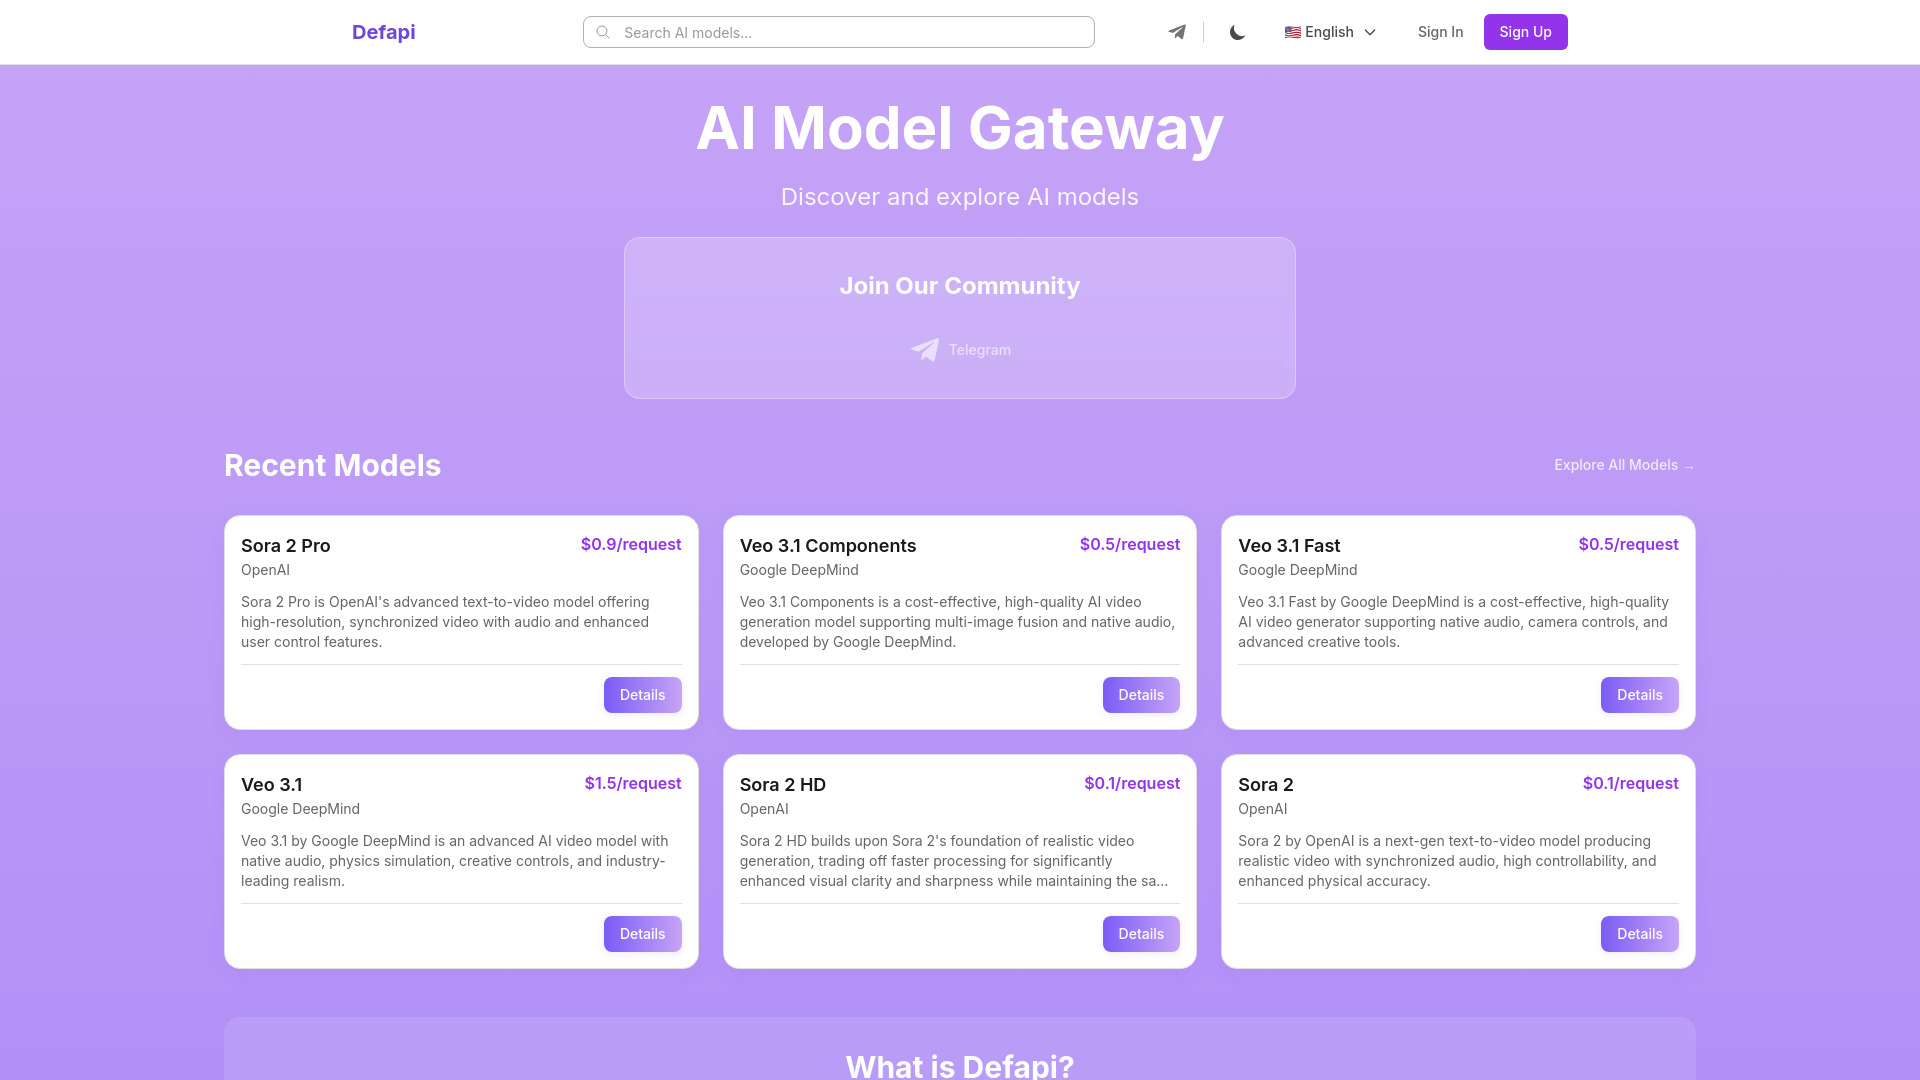
Unified API gateway providing affordable, single-point access to leading AI models like GPT, Claude, and Gemini.
 Coralogix
Verified
DevOps & CI/CD
Coralogix
Verified
DevOps & CI/CD
Full-stack observability platform that ingests, analyzes, and correlates logs, metrics, and traces in real time
 Dynatrace
Verified
Developer Tools
Dynatrace
Verified
Developer Tools
AI-powered observability platform that monitors apps, infrastructure, and security in real-time
 OneUptime
Verified
Developer Tools
OneUptime
Verified
Developer Tools
Open-source observability platform combining monitoring, incident management, status pages, logs, metrics, and AI-powered incident resolution.