
PaperBanana
Этот AI-инструмент берет ваши научные данные и сам превращает их в аккуратные графики и диаграммы, которые можно сразу вставлять в публикацию.
| Что это | Этот AI-инструмент берет ваши научные данные и сам превращает их в аккуратные графики и диаграммы, которые можно сразу вставлять в публикацию. |
|---|---|
| Цены | Paid — от $6.99/mo |
| Бесплатный тариф | Нет |
| Платформа | Web Application |
| API | Да |
| Хорошо подходит для | creating methodology diagrams for research papers, generating statistical plots from research data |
| Домен зарегистрирован | 2026 |
Данные обновлены 19 сентября 2026 г.
Что делает PaperBanana?
Знакомьтесь, PaperBanana — это AI-инструмент, созданный специально для ученых и исследователей, которым нужны качественные иллюстрации для статей и презентаций. Суть проста: вы описываете текстом свою методологию, данные или концепции, а сервис превращает их в профессиональные диаграммы, статистические графики и инфографику, которые соответствуют строгим стандартам академических публикаций. С помощью PaperBanana можно создать что угодно — от схемы архитектуры нейросети до точной визуализации данных, и при этом вам вообще не нужно быть дизайнером.
Внутри работает интересная система из пяти специализированных AI-агентов, которые взаимодействуют друг с другом. Retriever ищет подходящие примеры, Planner структурирует ваш контент, Stylist следит за соблюдением академического стиля, Visualizer отрисовывает изображение, а Critic проверяет результат и помогает его доработать. Такой подход гарантирует, что итоговая картинка будет не только красивой, но и технически верной. Кстати, для статистических графиков инструмент может генерировать исполняемый код на Python Matplotlib, чтобы обеспечить абсолютную точность цифр.
PaperBanana станет отличным помощником для AI-исследователей, data scientists, аспирантов и всех, кто регулярно пишет статьи. Это идеальный вариант для тех, кто хочет быстро подготовить иллюстрации уровня конференций NeurIPS, ICML или ICLR, не тратя часы на ручную отрисовку в графических редакторах.
Ключевые возможности
Что выделяет инструментДля кого PaperBanana?
Кому подходит этот инструментЦены
Starter
- 2 400 кредитов (120 изображений)
- Срок действия — 1 год
- Доступ ко всем стилям иллюстраций
- Загрузка в высоком разрешении
- Стандартная скорость генерации
- Поддержка по электронной почте
Popular
- 19 200 кредитов (960 изображений)
- Срок действия — 1 год
- Доступ ко всем стилям иллюстраций
- Загрузка в высоком разрешении
- Приоритетная очередь генерации
- Приоритетная поддержка по электронной почте
Pro
- 72 000 кредитов (3 600 изображений)
- Срок действия — 1 год
- Доступ ко всем стилям иллюстраций
- Загрузка в высоком разрешении
- Максимальная скорость генерации
- Персональный менеджер поддержки
Доверие и присутствие
Галерея
Нажмите на изображение, чтобы увеличитьАльтернативы в категории Научная визуализация
 PaperBanana
Проверено
Научная визуализация
PaperBanana
Проверено
Научная визуализация
Этот AI-инструмент превращает обычные текстовые описания в полноценные академические иллюстрации. С его помощью можно быстро создать схемы методологии или статистические графики, которые будут выглядеть профессионально и сразу подойдут для публикации в научной работе.
 PaperPlot
Проверено
Научная визуализация
PaperPlot
Проверено
Научная визуализация
Создавайте профессиональные научные диаграммы, готовые для публикации, прямо из текста.
 PaperClaw
Проверено
Научная визуализация
PaperClaw
Проверено
Научная визуализация
Инструмент на базе AI, который превращает текстовые описания или простые наброски в профессиональные научные иллюстрации и диаграммы. На выходе вы получаете качественные изображения, готовые к публикации, или редактируемые SVG.
 PaperFig
Проверено
Научная визуализация
PaperFig
Проверено
Научная визуализация
Инструмент на базе AI для создания научных иллюстраций. Просто опишите словами, что вам нужно, набросайте черновой скетч или загрузите готовое изображение — и через пару секунд вы получите качественную схему, которую не стыдно вставить в публикацию.
 SciFig
Проверено
Научная визуализация
SciFig
Проверено
Научная визуализация
Знакомьтесь, SciFig — бесплатный AI-генератор научных иллюстраций, созданный специально для исследователей. Он позволяет за считанные минуты превратить текст, наброски, референсы, PDF-файлы или даже обычные фото из лаборатории в полноценные фигуры для публикаций. При этом всё — от подписей и макета до цветов — можно легко отредактировать под себя.
 FigEditor AI
Проверено
Научная визуализация
FigEditor AI
Проверено
Научная визуализация
Инструмент на базе AI, который превращает текст, наброски или референсы в полноценные научные иллюстрации, блок-схемы и фигуры. Главный плюс — всё созданное легко редактируется.
 SciFigureAI
Проверено
Научная визуализация
SciFigureAI
Проверено
Научная визуализация
Этот AI-инструмент превращает ваши идеи, тезисы или даже наброски от руки в аккуратные черновики научных иллюстраций. Идеально подходит, когда нужно быстро подготовить качественные схемы для статей или презентаций.
 Scientific figure
Проверено
Научная визуализация
Scientific figure
Проверено
Научная визуализация
Бесплатный ИИ-генератор научных иллюстраций — превращайте текстовые промпты, наброски, аннотации или PDF в редактируемые фигуры для публикаций.
Похожие инструменты
 PaperBanana
Проверено
Генерация диаграмм
PaperBanana
Проверено
Генерация диаграмм
Инструмент на базе AI, который превращает текстовые описания в полноценные научные иллюстрации, схемы и фигуры. Всё сразу в том качестве, которое подходит для публикации в статьях, на постерах или в презентациях.
 Nano Banana Pro
Проверено
Генератор изображений
Nano Banana Pro
Проверено
Генератор изображений
AI-генератор изображений и фоторедактор — создавайте профессиональные визуалы по текстовым запросам за считанные секунды.
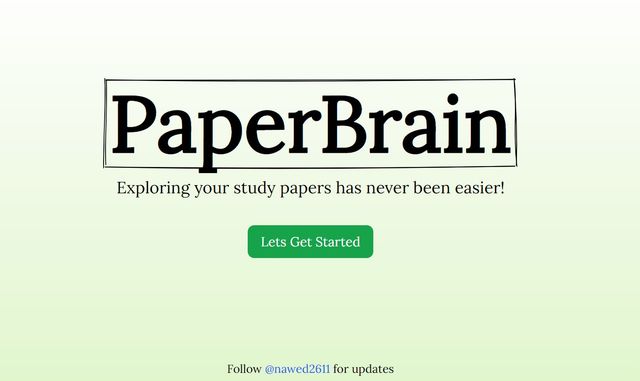 PaperBrain
Проверено
Инструмент для исследований
PaperBrain
Проверено
Инструмент для исследований
Ваш личный AI-помощник по исследованиям: ищите нужное в научных работах, создавайте краткие выжимки, общайтесь с текстами в чате или даже превращайте статьи в аудиоподкасты.
 nanabanana2.run
Проверено
Генератор изображений
nanabanana2.run
Проверено
Генератор изображений
Генератор изображений на основе AI, который специализируется на безупречном отображении текста. Идеальный инструмент для создания чистых и профессиональных инфографик, диаграмм и контента на нескольких языках. Больше не придётся беспокоиться о кривых надписях!